
Inflation is back at the center of the market.
The issue is no longer just prices. The bigger issue is which data the Federal Reserve, funds, banks, and traders rely on.
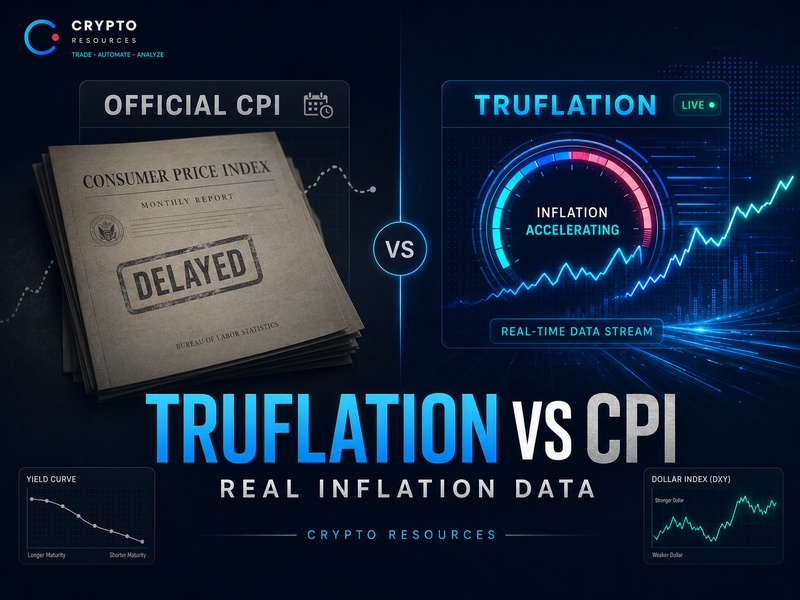
Official CPI remains the main public inflation benchmark in the United States. Markets wait for it, rate expectations move around it, and it affects how investors price the dollar, bonds, Nasdaq, Bitcoin, and altcoins.
CPI has one clear weakness: it is published with a delay and built on an old institutional methodology.
When the economy moves slowly, that works. When energy, rent, consumer demand, and financial conditions change quickly, a monthly report can describe a phase the market has already moved past.
That is why Truflation is getting more attention.
Truflation is an alternative inflation indicator that updates daily and uses modern consumer price and spending data. Truflation describes its index as a daily inflation index built on more modern data sources.
For markets, this is a practical issue.
If official CPI is still above 4%, while a faster inflation gauge is already closer to 2%, investors may reassess the future Fed rate path, the dollar, bond yields, and risk appetite.
That also changes the backdrop for crypto.

What Is CPI?
CPI stands for Consumer Price Index. In the United States, it is published by the Bureau of Labor Statistics.
It is the official index that tracks changes in the cost of a consumer basket. CPI is not the Fed’s only inflation metric, because policymakers also watch PCE and core PCE. Still, for markets, CPI remains one of the most important macro releases.
CPI matters for several reasons:
- it is an official government index;
- it has a long historical record;
- it is used in contracts, indexation, and economic models;
- bonds, the dollar, equities, and crypto react to it;
- it affects expectations for the Fed’s rate path.
The weak point of CPI is speed.
The report is released once a month. Data has to be collected, processed, adjusted to the methodology, and published. During that time, the market may already move into a new phase.
Oil may reverse.
Rent may cool.
Demand may weaken.
Yields may move higher or lower.
The dollar may change direction.
Official statistics record inflation by the rules. Markets trade expectations.
That is where the gap appears between the report and the current market picture.

Why CPI Can Lag
The most sensitive part of CPI is housing costs.
The BLS says the housing component is one of the largest parts of the CPI consumer basket. Its main elements are rent of primary residence and owners’ equivalent rent.
Owners’ equivalent rent estimates how much a homeowner would pay to rent their own home. It is not an actual mortgage payment and not the current market price of the house.
According to BLS data for December 2025, the housing component accounted for 35.625% of the CPI basket, while owners’ equivalent rent of residences accounted for 26.204%.
For official statistics, this approach makes sense. A home is not only an asset. It also provides a housing service. That service has to be included in the consumer basket.
For markets, the problem is timing.
Housing components can move more slowly than current market prices. As a result, CPI can keep carrying an old inflation tail even when faster data already shows cooling.
The delay looks like this:
- Market prices change.
- Faster indicators catch the turn.
- CPI keeps reflecting older data inertia.
- Markets start questioning the official release.
- The Fed receives a tighter-looking picture later than faster data sources do.
In a calm environment, this does not break the model. At a turning point, it can change the entire path of rate expectations.
What Is Truflation?

Truflation is an alternative inflation index designed to show the current temperature of the economy faster.
It updates daily, uses data from many providers, and focuses on high-frequency measurement. On its index page, Truflation lists daily updates and more than 30 data providers, including Zillow, AAA Gas Prices, Kantar, NielsenIQ, Insurify, and Amazon.
Truflation also says its index uses modern consumer price and spending data, while older metrics can lag an economy changed by Covid-19, money supply growth, and global supply-chain disruptions.
Truflation does not replace official CPI.
Its role is different: it gives markets a faster read on inflation pressure.
CPI answers one question: what inflation did official statistics record?
Truflation answers another: what is happening to inflation now, according to faster data?
For a macro trader, the second question often matters earlier in the trade.
Truflation vs CPI: Key Differences
The difference between CPI and Truflation is not just one number.
They are different ways of measuring inflation.
CPI
- official BLS index;
- released once a month;
- based on an approved government methodology;
- useful for long-term historical comparison;
- embedded in the institutional system;
- can lag during turning points.
Truflation
- alternative real-time indicator;
- updates daily;
- uses modern consumer and pricing data;
- reacts faster to price changes;
- useful as an early macro indicator;
- does not have official government CPI status.
CPI is needed by the system.
Truflation is needed by the market.
The conflict starts when the official index still shows overheating, while faster data already shows cooling.
Current Example: CPI at 4.2% vs Truflation Below 2%
A recent example shows the problem clearly.
The BLS reported that CPI rose 4.2% over the 12 months ending in May 2026. That was the largest 12-month increase since April 2023.
In late June 2026, Truflation showed a reading of around 1.94% year over year, while the official BLS reported rate was 4.20%.
That is a large gap.
Official CPI says inflation is still high.
The faster indicator says current pressure is already much lower.
This gap should not be read mechanically. One metric does not make the other useless.
CPI remains the official base.
Truflation adds a faster market layer.
For traders, the value is not in arguing with the BLS. The value is in spotting when markets start repricing the future rate path before official confirmation arrives.
If CPI is high but Truflation is falling, bonds and the dollar may start pricing a softer scenario before it appears in official releases.
If CPI is high and Truflation is also rising, the backdrop remains tight. In that environment, risk assets usually stay under pressure.
Where Warsh Fits In
Kevin Warsh has pushed this debate further.
Reuters reported that Warsh wants the Fed to improve its ability to use higher-quality real-time economic data within 9 to 12 months. He also criticized reliance on government reports that may suffer from measurement problems, outdated survey methods, and data delays.
This does not mean Warsh is directly promoting Truflation.
The correct framing is broader: Warsh is pushing for more modern data at the Fed. Truflation fits that trend as an example of a faster inflation indicator.
The old approach: wait for the official report.
The new approach: look at the economy more often and from more angles.
For the Fed, this is a serious shift. The central bank cannot fully abandon official statistics, because the institutional system depends on them. But relying only on monthly reports is becoming harder.
The economy is faster.
The data set is wider.
Markets react instantly.
A central bank that sees the inflation turn too late may keep conditions tight for too long. A central bank that trusts softer alternative data too early may miss a new inflation wave.
That is why a strong model has to look at a group of indicators:
- CPI;
- PCE;
- core PCE;
- trimmed mean inflation;
- median inflation;
- Truflation;
- inflation expectations;
- bond yields;
- the dollar;
- commodities;
- credit spreads.
One index does not cover the whole picture.
Why This Matters for Bitcoin and Crypto
Crypto does not react only to inflation. Crypto reacts to liquidity expectations.
For Bitcoin, Ethereum, and altcoins, the key variables are the Fed rate, the dollar, yields, Nasdaq, and broader risk appetite.
When CPI comes in above expectations, markets usually price a more hawkish Fed:
- yields rise;
- the dollar gets support;
- risk appetite tightens;
- Nasdaq comes under pressure;
- Bitcoin and altcoins often fall harder than the broader market.
When faster inflation data shows cooling, markets can start pricing a different scenario:
- the policy rate is closer to its peak;
- pressure on the dollar eases;
- long-duration bonds get support;
- risk assets get room to recover;
- crypto reacts earlier to the shift in expectations.
But Truflation below CPI is not a buy signal for Bitcoin.
It is a market-regime filter.
It shows that current inflation pressure may be softer than the official picture. The next step is to check confirmation through bonds, the dollar, equities, and crypto itself.
If Truflation is falling but yields are rising, the dollar is strong, and Bitcoin cannot hold key levels, the inflation argument is not enough.
If Truflation is falling, yields are cooling, the dollar is weakening, and Bitcoin is holding its range, the risk backdrop becomes more constructive.
How to Use Truflation in Market Analysis
Truflation is best used as an early macro layer.
A practical workflow:
- Track official CPI and PCE.
- Use Truflation as a daily inflation read.
- Measure the gap between official and faster inflation data.
- Check the dollar, yields, gold, Nasdaq, and Bitcoin.
- Make the final call only from the combined picture.
Scenarios:
- High CPI, falling Truflation — markets may start pricing easing earlier.
- High CPI, rising Truflation — the inflation regime remains tight.
- Falling CPI, falling Truflation — better backdrop for risk assets.
- Falling CPI, rising Truflation — risk of a new inflation impulse.
- Falling Truflation, rising dollar and yields — no confirmation for risk yet.
For crypto, the liquidity link matters most. Inflation itself does not move Bitcoin in isolation. Bitcoin moves on the repricing of future conditions: the policy rate, the dollar, the Fed balance sheet, yields, and demand for risk.
Limitations of Truflation
Truflation has its own weaknesses.
It is an alternative index. It is not official BLS statistics and does not replace CPI in the institutional system. Its data can react faster to the market, but that speed also makes it more sensitive to short-term moves.
A fast indicator catches turns earlier.
A fast indicator can also produce noise earlier.
That is why Truflation should not be used separately from other macro metrics.
A stronger signal appears when several independent layers point in the same direction:
- Truflation is cooling;
- CPI starts catching down;
- yields stop rising;
- the dollar loses strength;
- markets lower rate expectations;
- risk assets begin to recover.
Only that combination carries weight.
Frequently Asked Questions
What is Truflation?
Truflation is an alternative inflation indicator. It updates daily and uses modern consumer price and spending data. Its purpose is to show current inflation dynamics faster than traditional monthly reports.
How should it be written: Trueflation or Truflation?
The correct project name is Truflation. The spelling Trueflation sometimes appears in searches, but the official name is written without the letter “e.”
How is Truflation different from CPI?
CPI is the official inflation index published by the BLS. It is released once a month and used in the institutional system. Truflation updates daily and reacts faster to price changes, but it does not have official government CPI status.
Why can CPI lag?
CPI is collected and published through an official methodology. Some components carry strong inertia, especially housing costs and owners’ equivalent rent. During sharp market changes, CPI can reflect an older phase of inflation.
Can Truflation be considered a more accurate inflation measure?
No. It is more accurate to treat Truflation as a faster market read. CPI remains the official standard. Truflation is useful as an additional indicator, especially when traders need to detect a turn in inflation pressure earlier.
Why does this matter for Bitcoin?
Bitcoin depends on expectations around liquidity, the Fed rate, the dollar, and yields. If markets see inflation cooling before official CPI confirms it, they may start repricing future Fed policy earlier. That affects demand for risk and crypto assets.
Can Truflation be used as a trading signal?
No. Truflation is better used as a market-regime filter. Low Truflation by itself does not mean Bitcoin or altcoins should be bought. Confirmation is needed through the dollar, yields, Nasdaq, liquidity, and the structure of the crypto market.
Why is Warsh important here?
Warsh supports broader use of real-time data at the Fed. His position strengthens the idea that the central bank cannot rely only on old monthly reports. That supports market interest in alternative inflation indicators such as Truflation.
Conclusion
CPI remains the official U.S. inflation measure. It cannot be ignored because the government system, bond markets, banks, funds, and most macro models still watch it.
But CPI is slow.
It is released once a month, relies on an old methodological base, and can lag during turning points. That is especially true where the housing component and owners’ equivalent rent carry a large weight.
Truflation shows another layer: a daily, faster inflation read. It does not cancel CPI, but it can help markets detect changes in inflation pressure earlier.
Warsh is raising that exact issue: the Fed needs a more modern data infrastructure. Not instead of official statistics, but alongside them.
For Bitcoin and crypto, this is an important shift.
Markets do not trade past inflation. They trade future liquidity. If faster inflation data cools before official releases confirm the turn, risk assets can start repricing before CPI catches up.
The working approach is simple: do not argue with one indicator. Build the picture from several layers. CPI, Truflation, yields, the dollar, Nasdaq, Bitcoin, and liquidity have to be read together.
That is where the edge appears.
Risk Disclaimer
This material is for informational and analytical purposes only. It is not investment advice, personal trading guidance, or a call to buy or sell cryptocurrencies, stocks, bonds, or any other financial instruments.
Macroeconomic indicators help assess the market backdrop, but they do not guarantee price direction. CPI, PCE, Truflation, the dollar, yields, and rate expectations should be analyzed together with market structure, liquidity, volume, and risk management.