
How to trade liquidations is one of the core questions for a futures trader. On Binance and Bybit, liquidation spikes often show where leveraged traders are forced out of their positions. In those moments, price moves through a level quickly, volume expands, open interest (OI) shifts, and part of the positioning is closed automatically by the exchange.

In Trap Radar PRO, liquidations are read together with price, OI, volume, CVD, VWAP and the funding rate. A liquidation spike alone does not give the full picture. A usable scenario needs a full combination: which side was hit, where the event happened, how far price moved from VWAP, and how the market reacts after leverage gets flushed.
For recovery scenarios, the key area appears after a sharp move. One side has already been forced out, price moved too fast, volume came in as a spike, and the market starts moving back toward a more balanced zone. This type of regime can be described in advance with rules and monitored through Trap Radar PRO on the selected exchange, including Binance and Bybit.
What Liquidations Show
A liquidation happens when a leveraged position cannot withstand a move against it.
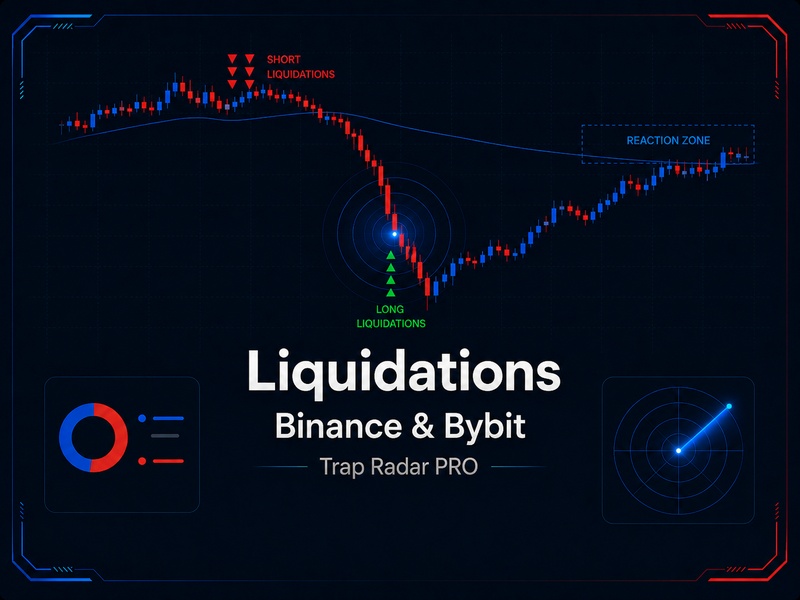
Longs are liquidated when price falls.
Shorts are liquidated when price rises.
After liquidation, forced order flow hits the market. Longs are closed through selling, shorts are closed through buying. That is why liquidations can accelerate the current impulse, while after a strong move the market often gives a technical bounce or pullback.
To read liquidations, we look at several factors:
- Which side was hit: long traders or short traders.
- Where the spike happened: at the start of the move or after an extended push.
- How far price moved from VWAP.
- Whether OI is rising or falling.
- Whether volume expanded.
- What CVD shows — the difference between aggressive buying and selling.
- How quickly price starts to return after the spike.
Liquidations show the zone where part of the market lost control of its position. The decision then depends on price reaction and the surrounding metrics.
Why Percentage to OI Matters More Than the Amount
The liquidation amount without context often distorts the picture. For a large coin, a big liquidation print can be normal market noise. For a less liquid asset, the same amount can mean a serious leverage flush.
The liquidation percentage to OI shows what share of open positions was wiped out during the selected window. This helps compare different coins and separate a meaningful event from background activity.
Percentage to OI helps assess:
- Whether the spike was meaningful for that specific coin.
- Whether the market removed a visible part of leverage.
- Whether the move still has positioning support.
- Whether the main hit against one side has already happened.
- Whether conditions for a technical bounce are present.
For Binance and Bybit, percentage to OI is especially useful as a filter. It helps avoid reacting to every large liquidation amount and focus on whether the event is actually significant for that instrument and its current open interest.
In Trap Radar PRO, these conditions can be set in advance. The Radar filters out weak spikes and waits for a situation where liquidations actually change the market balance.
When Recovery Appears After a Spike
After a strong liquidation move, the market often becomes uneven. Price moves through an area quickly, liquidity around nearby levels changes, some traders are forced out, and new participants start evaluating continuation or return.
Recovery appears where the move has already removed part of the leverage, but price stops accelerating against the liquidated side. This can be a technical bounce after a sharp drop or a pullback after an overheated rally.
For a long scenario, we are interested in the zone after downside pressure:
- Long traders have already been liquidated.
- Price moved below the local balance area.
- Volume expanded sharply.
- RSI cooled down.
- CVD shows aggressive buyers starting to appear.
- Price makes the first push higher.
For a short scenario, we are interested in the zone after a sharp rally:
- Short traders have already been liquidated.
- Price moved above the local balance area.
- Volume expanded sharply.
- RSI is elevated.
- CVD shows aggressive sellers starting to appear.
- Price makes the first push lower.
In both cases, we work with the reaction after liquidation. If the move continues, it can be managed with trailing. If price immediately stalls or moves against the scenario, the signal is better skipped.
Example Long Configuration: Bounce After Long Liquidations

Trap Radar PRO can be configured for a situation where the market sharply liquidated long traders, but early recovery signs appeared after the liquidation flush.
The long configuration tracks a short-window drop, long liquidations, price deviation toward the lower area relative to 30m VWAP, cooled RSI, a volume spike, and aggressive buyers appearing through CVD.

This scenario does not require catching the exact bottom. The market has already hit long leverage, part of the positioning has been closed by force, sellers created a strong impulse, and price starts to return.
To review the signal, the trader checks:
- Whether the local low holds after the spike.
- Whether buyers appear on the lower timeframe.
- Whether price avoids falling back below the low.
- Whether volume supports the recovery.
- Whether CVD remains fully controlled by sellers.
If recovery continues, the move can be managed with trailing. This allows the scenario to capture more than the first technical bounce if the market shifts from a sharp flush into a more stable return.
Example Short Configuration: Pullback After Short Liquidations
A mirrored configuration can be built for a pump where short traders have already been liquidated, price moved above the local balance area, and early signs of a pullback appeared.
The short scenario tracks a short-window rise, short liquidations, price near or above 30m VWAP, elevated RSI, a volume spike, aggressive sellers appearing through CVD, and the first push lower.
This signal appears after an overheated move. Shorts have already been hit, late buyers entered high, and the market starts returning after the acceleration.
To review the signal, the trader checks:
- Whether the new high starts to weaken.
- Whether sellers appear on the lower timeframe.
- Whether price avoids immediate upside acceleration.
- Whether volume supports the pullback.
- Whether CVD shows pressure from aggressive sellers.
If the pullback develops, the move can be managed with trailing. This helps avoid closing on the first small move down if the liquidation spike turns into a deeper return toward VWAP or the nearest balance area.
How Trap Radar PRO Helps Monitor These Scenarios
Trap Radar PRO allows traders to describe in advance when a liquidation spike becomes worth checking.
A scenario can include:
- Long or short liquidations.
- Liquidation percentage to OI.
- Price deviation from VWAP.
- Price movement over a short window.
- OI change.
- Volume spike.
- CVD through the difference between aggressive buys and sells.
- RSI as an overheating or cooling filter.
- Funding rate.
- Coin liquidity filter.
- The exchange where the scenario is monitored.
In a long configuration, the Radar waits for a drop, long liquidations, cooled RSI, a volume spike, aggressive buyers appearing, and the first push higher.
In a short configuration, the Radar waits for a pump, short liquidations, elevated RSI, a volume spike, aggressive sellers appearing, and the first push lower.
When the conditions match, the user receives a signal in Telegram or in the personal dashboard. The chart is then reviewed manually, or the scenario is passed to automated execution through an API/bot if that setup is configured.
The Radar tracks a combination of factors: liquidations, imbalance, volume, positioning, and the first price move toward recovery.
Common Mistakes
- Reading liquidations without price reaction. The spike itself does not show whether recovery has started.
- Relying only on the liquidation amount. Percentage to OI gives a clearer view of the event’s weight for a specific coin.
- Entering on the first candle after the spike. After a large liquidation event, the market can still deliver another impulse against the position.
- Ignoring VWAP. When price is far from the balance area, recovery is read differently than movement inside the range.
- Ignoring OI. After the spike, it is important to know whether traders are adding positions or leaving the market.
- Ignoring CVD. If price is recovering but the aggressive side does not confirm the move, the signal is weaker.
- Using the scenario on weak coins without a liquidity filter. On those assets, spikes are sharp but harder to read systematically.
- Not separating Binance and Bybit conditions. The same coin can show different liquidation, OI and volume behavior across different venues.
How to Use Liquidations in the Workflow
Liquidations are best used as part of a scenario, not as a standalone reason to enter.
Working sequence:
- Choose the exchange: Binance or Bybit.
- Choose the direction: long after long liquidations or short after short liquidations.
- Set the liquidation side.
- Define the minimum spike weight relative to OI.
- Add a VWAP filter.
- Add short-window price movement.
- Add OI change.
- Add a volume spike.
- Add CVD.
- Limit coins by liquidity.
- Review chart reaction before execution.
This turns liquidations into part of a trading system. The scenario waits for a repeatable market situation: leverage flush, imbalance and an attempt to recover.
For Binance and Bybit, liquidity, open interest, funding rate and post-spike price quality should be filtered separately. The same scenario is better evaluated through exchange-specific statistics instead of copying settings mechanically from one venue to another.
FAQ
What do crypto liquidations show?
Liquidations show forced closure of leveraged positions. Longs are liquidated when price falls, shorts are liquidated when price rises.
Why is liquidation percentage to OI more important than the amount?
Percentage to OI shows the weight of the spike for a specific coin. The same liquidation amount can be noise on a large asset and a strong event on a less liquid coin.
Can liquidation spikes be traded on Binance and Bybit?
Yes, if liquidations are used as part of a scenario. Price reaction, OI, CVD, volume, VWAP and instrument liquidity should be checked together with the spike.
How does Trap Radar PRO monitor these situations?
Trap Radar PRO allows users to set conditions based on liquidations, percentage to OI, VWAP, price, OI, volume, CVD, RSI, funding rate, coin liquidity and the selected exchange.
Can trailing be used after this type of signal?
Yes, if the move continues after the spike. Trailing helps manage the recovery and avoid closing only on the first small bounce or pullback.
Conclusion
Liquidations show zones where the market forcibly removes participants from leveraged positions. After this type of spike, imbalance often appears: price moves away from VWAP, volume rises, OI changes, and then the market attempts to recover.
In Trap Radar PRO, this situation can be described with rules. For a long, the scenario looks for recovery after long liquidations. For a short, it looks for a pullback after short liquidations. For Binance and Bybit, scenarios are better separated by exchange, liquidity, OI, funding rate and signal statistics.
The workflow stays disciplined: conditions, signal, chart review, decision, management, statistics. A liquidation spike becomes part of a clear trading system rather than random noise on the chart.
Risk Disclaimer
Signals and scenarios do not guarantee results.
Any trading system requires testing, risk control and evaluation across a series of trades.
This material is educational and is not investment advice.