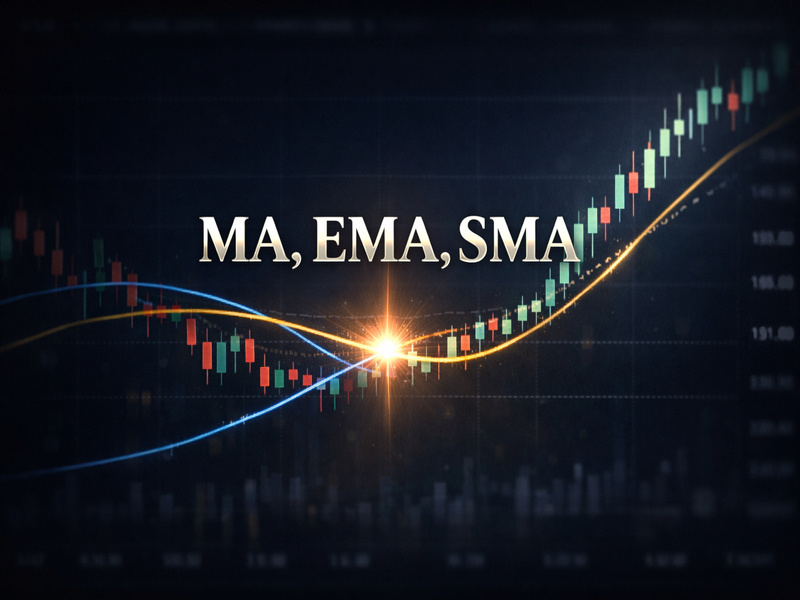
MA, EMA, and SMA are basic tools many traders start with when learning to read a chart. They do not provide a ready-made forecast and they do not replace market structure, volume, or risk management. Their role is simpler: smooth out noise, show the direction of movement, and provide a framework for discipline. When we use moving averages in that role, they fit well into a working system and do not overload the analysis.
What MA, EMA, and SMA Are
MA is the general name for moving averages. It is the average price over a selected period.
SMA is a simple moving average. It gives every candle in the period the same weight. If the chart uses SMA 20, each of the last twenty candles affects the calculation equally.
EMA is an exponential moving average. It gives more weight to the latest candles and therefore reacts faster to price changes.
The difference comes down to this:
- MA is the general class of indicators.
- SMA is a calmer and more inert average.
- EMA is more sensitive and faster.
That leads to a practical conclusion: when speed of reaction to the current impulse matters, traders usually choose EMA. When a smoother picture with fewer swings matters more, SMA is often more convenient.
How SMA Differs from EMA on a Chart
The main difference between SMA and EMA is reaction speed.
SMA moves more slowly. Because of that, it smooths out market noise better and reacts less to every local spike. In a range, that often gives a cleaner picture.
EMA reacts faster. That is useful in a trend, when price regularly pulls back to the average and then continues moving. But in a choppy market, that same sensitivity produces false signals more often.
On a chart, this is usually obvious:
- EMA turns earlier with price.
- SMA keeps the broader shape of the move longer.
- The lower the timeframe, the more visible the difference becomes.
Which MA, EMA, and SMA Periods Are Used Most Often
There is no single correct period for all situations. The period should match the task.
The standard set of periods looks like this:
- 9 and 10 for fast moves inside an impulse.
- 20 and 21 for short-term trend and pullbacks.
- 50 for a more stable average support level.
- 100 as an intermediate reference point.
- 200 as a large trend filter.
This is usually applied in the following way:
- EMA 20 or EMA 21 to see the speed of the current move.
- SMA 50 or EMA 50 to assess a more stable structure.
- MA 200 to understand what broader market regime the asset is in.
The point is not to load the chart with more lines, but to give each average a specific role.
How We Read Moving Average Signals
A single line outside of context means very little. What matters is not the average itself, but how price behaves around it.
First, we look at five things:
- the direction of the average itself;
- whether price is above or below it;
- what the pullback to the average looks like;
- whether the market holds the average after a test;
- how far price is stretched away from the average.
If the average is rising, price stays above it, and pullbacks are bought quickly, that usually points to a strong upward move. If the average points down and price cannot reclaim it with acceptance, sellers usually still have the edge.
The slope of the line also matters. A flat average usually points to a neutral section. A line clearly pointing up or down usually reflects a defined trend.
Moving Average Crossovers: When They Help and When They Get in the Way
A crossover between two moving averages is a well-known signal, but outside of context it is often late.
The classic setup looks like this:
- a bullish crossover is when the faster average moves above the slower one;
- a bearish crossover is when the faster average moves below the slower one.
The problem is that a crossover confirms a change that has already happened rather than warning about it in advance. In a strong trend, that can still be useful as a filter. In a sideways market, that logic often turns into a series of unnecessary entries and exits.
That is why it is better to use a crossover not as a standalone trigger, but as part of a system:
- first define the market regime;
- then check where price is relative to the higher-timeframe average;
- only after that use the crossover as confirmation.
The Average as Dynamic Support and Resistance
EMA and SMA often act as a floating zone from which price either continues moving or starts showing loss of momentum.
In an uptrend, we often see the same pattern: price moves higher, then pulls back to EMA 20 or EMA 21, holds it, and gets a new impulse. In a calmer phase, the market may start leaning on the 50-period average instead.
In a downtrend, the logic is reversed. Price tests the average from below, fails to reclaim it, and then moves lower again.
What matters here is not the line on its own, but the reaction around it:
- whether the level is defended;
- whether volume shows up;
- whether candle bodies hold on the needed side of the average;
- whether the pullback becomes trend continuation or a full break.
How to Combine MA, EMA, and SMA with Timeframes
Moving averages work noticeably better when each one is assigned to a specific task.
One of the most practical setups looks like this:
- the higher timeframe defines direction through MA 200 or SMA 200;
- the working timeframe shows the current structure through EMA 20 and EMA 50;
- the lower timeframe is used for a more precise entry after a pullback or confirmation.
This approach helps avoid fighting the larger move. If price is firmly below MA 200 on the higher timeframe and the working timeframe only shows a technical bounce, an aggressive long based on a single fast EMA is a weak idea.
Basic Settings for Different Tasks
Different tasks require different moving averages.
For the broader trend, traders most often use:
- SMA 200;
- EMA 200;
- SMA 100 in a more active model.
For pullback entries inside a trend, the most common choices are:
- EMA 20;
- EMA 21;
- EMA 50.
For a calmer structure read, traders often use:
- SMA 50;
- SMA 100.
For intraday work in fast conditions, the common set is:
- EMA 9;
- EMA 20;
- EMA 50.
The key question is not which average is better on its own, but which task it performs inside the system.
Basic Discipline Rules
Moving averages are useful only when we already understand how we read them.
We stick to several simple rules:
- we do not make decisions from a single touch of the average;
- we do not trade a crossover without evaluating the regime;
- we do not open a trade only because price is above EMA;
- we do not mix signals from different timeframes without a clear priority;
- we do not change periods after every weak trade.
If an average is part of the system, its role must stay stable. It cannot define trend today, entry tomorrow, and exit the day after simply because that makes the result easier to explain.
Common Mistakes
The main mistake is expecting too much from the averages themselves.
The most common mistakes are:
- trying to catch a reversal with one line and no confirmation;
- trading crossovers inside a sideways market;
- using too many averages on one chart;
- constantly changing periods after a series of weak trades;
- ignoring the higher timeframe;
- entering too far from the average after the impulse has already played out.
Another mistake is treating MA, EMA, and SMA as a forecasting tool. A moving average shows what is already happening in the market. It helps us work with the regime instead of guessing the future.
Workflow for Using Moving Averages
Before the trade. First, we define the market regime on the higher timeframe. We check where price is relative to MA 200 or another base average used in the system. Then we identify which average is responsible for the working pullback and how price behaves around it.
During the trade. We watch not only the touch of the average, but also the quality of the hold. We want to see whether price can stay on the required side of the line, whether volume reacts, and whether continuation is confirmed.
After the trade. We review whether the average actually performed the role assigned to it in advance. If the entry was built around EMA 20, the review should follow that exact logic rather than a hindsight explanation built after the fact.
Mini Cases
Case 1. Rising market and a pullback to EMA 20. The asset holds above MA 200 on the four-hour chart. On the one-hour chart, price forms higher lows and regularly returns to EMA 20. One of the pullbacks shows seller slowdown, lower wicks, and a quick recovery above the average. In that structure, EMA 20 acts as dynamic support. What matters is not the line by itself, but the fact that the market remains in trend and participants continue defending the move.
Case 2. Sideways market and false crossovers. Price spends several days inside a range. EMA 20 and SMA 50 keep crossing, but neither side gets continuation. Buyers and sellers keep alternating control over local noise. This is a typical section where mechanical crossover trading starts producing unnecessary entries. In a range, moving averages do not lead the market. They only lag behind it.
Case 3. Losing MA 200 as a regime shift. The asset spent a long time above MA 200, but then started trading steadily below it. Attempts to reclaim it remain weak, and the average itself gradually turns lower. In that situation, MA 200 is useful not as an entry point, but as a regime filter. As long as price stays below that zone and fails to reclaim it and hold above it, the market logic has changed.
Where MA, EMA, and SMA Really Help and Where They Do Not
Moving averages are especially useful for three tasks:
- filtering the trend;
- finding pullbacks inside the move;
- assessing market strength or weakness.
They work worst in the following conditions:
- a chaotic section with no defined regime;
- a narrow sideways range;
- an attempt to catch the earliest possible reversal;
- trading without using volume, structure, and the higher timeframe.
The average gives the framework. Context gives the decision.
How We Use This in a Working Setup
When we bring moving averages into real trading work, we are interested not in the line itself, but in a clear decision-making process. That is why moving averages are best combined with regime filters and market selection tools. In our workflow, that role can be supported by Market Median for the broader phase, MA200 and median RSI for the condition of the asset, and crypto screeners for funding rate, liquidations, and open interest. From there, the scenario can be executed manually or through trading robots: Spot-Bot and ST-Bot if that matches the regime and risk parameters. This approach does not guarantee a result, but it makes trade management more consistent.
FAQ
What is better: SMA or EMA?
That depends on the task. EMA reacts faster to price and is more convenient in an active trend. SMA is calmer and smooths out noise better.
Can we trade using only moving average crossovers?
Yes, but in pure form that is usually a weak setup, especially in a sideways market. A crossover works better as confirmation than as the only signal.
Which average is better for defining the broader trend?
Most often, traders use MA 200, SMA 200, or EMA 200. This is a standard regime filter, not a universal law of the market.
Which settings are suitable for a beginner?
A simple set is usually enough: EMA 20, SMA 50, and MA 200. That already gives enough structure to see pace, trend, and market context.
Why does price sometimes break an average and then return back immediately?
Because a moving average is not a rigid level. It is a floating zone. A quick break without acceptance often means noise or liquidity collection rather than a regime change.
Conclusion
MA, EMA, and SMA are useful not because they provide an exact forecast, but because they bring order to chart reading. They help separate trend from noise, evaluate the quality of a pullback, and reduce emotional decision-making. If each average has a clear function, it strengthens the system. If lines are added to the chart without a role or a workflow, they add very little value.
Risk Disclaimer
Moving averages do not guarantee profits and do not protect against losses. Any signal should be checked against market regime, structure, and risk management. Every trading decision remains the trader’s own responsibility.